

03 Jan Expected Threat For Measuring Attack Contribution – Use Case on Serie A 2022/23
What is the correct metric to measure a single player’s attack contribution in a football match?
Is it goals, assists, expected goals, expected assists? While we may never find a perfect answer, Expected Threat (xT) works on a simple but effective process. For example, if a player has a ball in a certain zone of the field, what’s the chance of scoring in the current possession based on where the ball is now?
The formula for deriving xT was developed by Karun Singh (see the link below), probably inspired by previous work of Sarah Rudd. He divides the entire football pitch into grids.
Here is a chart that show our xT, with a model built using multiple seasons of 6 different elite football competitions’ data. The value in each grid correspond to the xT from that position, which can be interpreted as the percentage chance of scoring from the possession when the ball is in that zone.

xT can be calculated considering all the offensive on-ball events a player is involved. It is possible to evaluate a player on pass skill only, or dribble skill, by removing his contributions in the situations that are not interesting for the analyst. Note that there can be negative contributions as there are some actions (f.e. backwards passes) that reduce a team’s chances of scoring.
The graphic below shows the xT per 90 of the most skilled players in Serie A in the season 22-23, before the Qatar World Cup started in December 2022. Players who played less than 650 have not been considered.
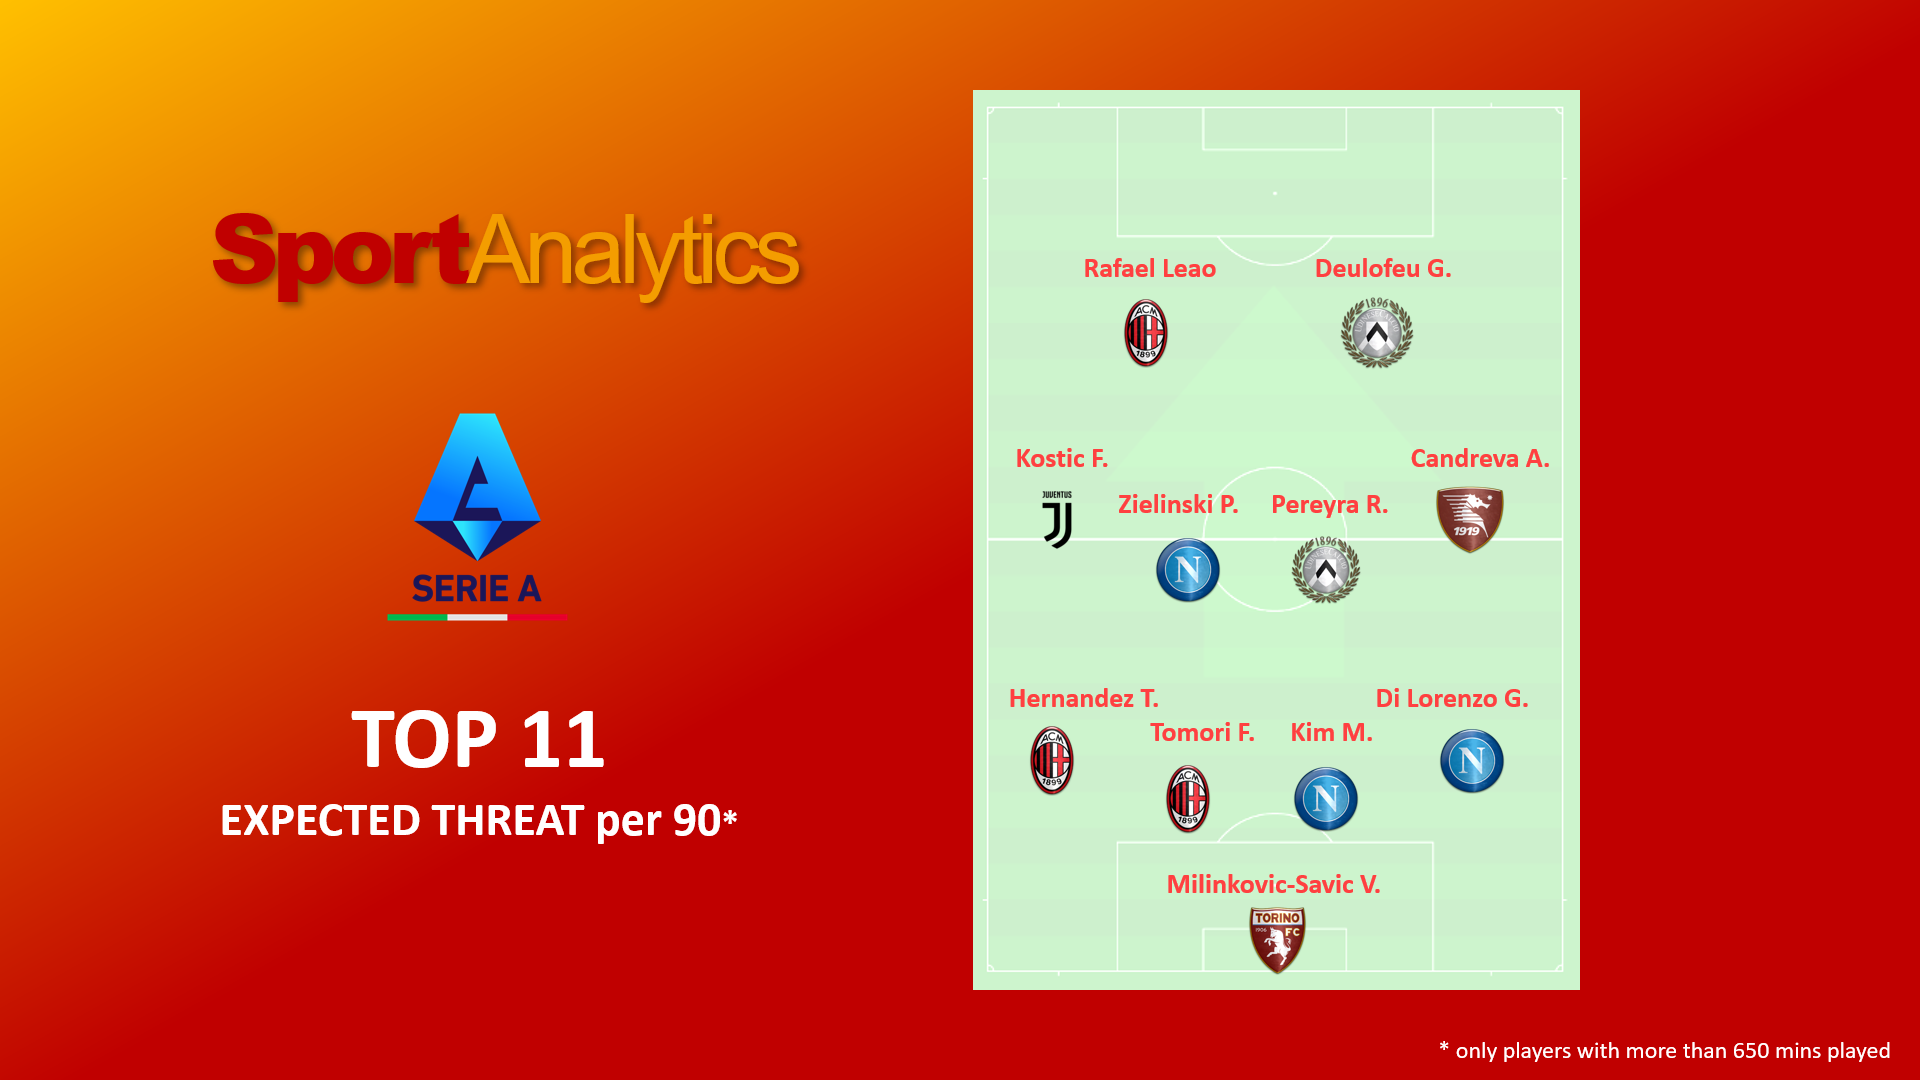
As a confirmation that the model works well, we immediately find some top players. Theo Hernandez is the most threatening ball progressor in the league, Rafael Leao’s ability to run with the ball on the break made him Milan’s most dangerous player, Filip Kostic is a value added for Juventus’ play thanks to his amazing contribution in crosses.
Breaking the xT down into its constituent parts, we can look at who specifically excels as a passer. In the following chart there is a comparison among some players of Juventus in the 22/23 season. Note that this is not normalized by the number of actions taken or minutes played, it is based on the raw sum of xT created.
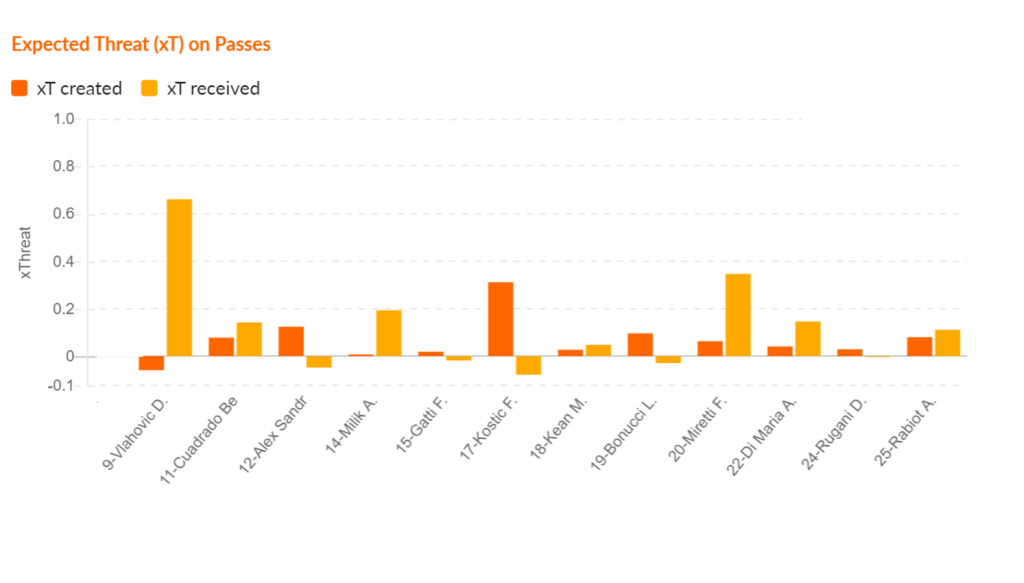
On one side, the chart shows how much Kostic gives an excellent contribution on passes. On the other, the role of Dusan Vlahovic as target player is highlighted by the highest xT received.
There are plenty of other applications of xT. There are also alternative models like VAEP (Valuing Actions by Estimating Probabilities), EPI (Estimated Player Impact), OBV (On-Ball Value).
Expected threat favours those players who risk getting the ball into dangerous areas, but the way the numbers above are derived doesn’t penalise them for consistently turning over possession.
The mentioned models still need improvements, which will be achieved as more data source get integrated into football, starting from tracking data. However, the xT model offers a brilliant insight into the game to evaluate players’ and teams’ play style.
Citations
Singh, K., https://karun.in/blog/expected-threat.html (2018)